
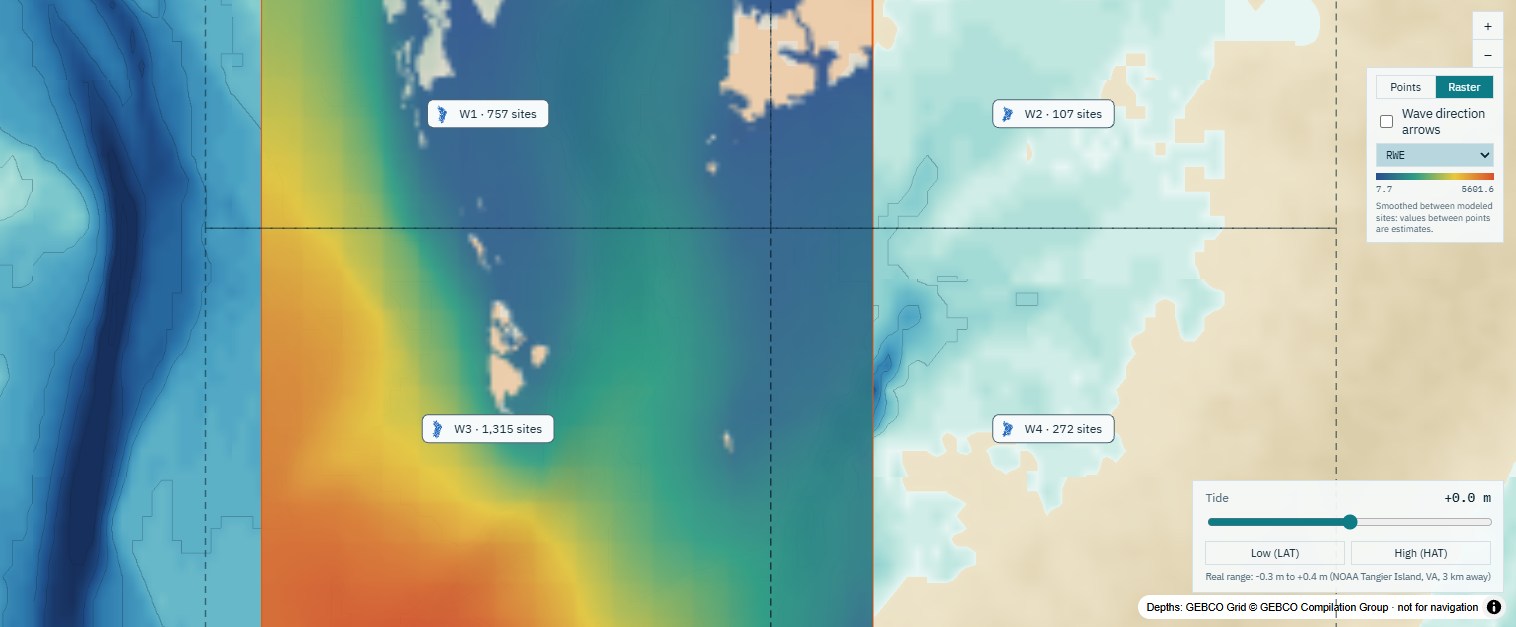
What WEMo calculates
For every site, weighted by how often and how hard the wind blows from each direction:
Wave height
The typical height of the wind waves reaching the site, in metres.
Wave energy (RWE)
Representative wave energy: wave energy per metre of crest, summed over all directions. Use it to compare how exposed sites are.
Orbital velocity
How fast the water moves at the seabed, for judging whether sediment or plants will be disturbed.
Bed shear stress
The drag of the waves on the seabed, for the sediment grain size you choose.
Results come as maps, five exposure classes, a PDF report, and CSV, GeoJSON and GeoTIFF files, or straight into your own scripts through the WEMo API. Hourly time series runs follow the wind hour by hour, to compare with buoys and other models. Runs can include ocean swell, vegetation and coastal structures (seawalls, breakwaters and sills).
Wave exposure for restoration, planning and siting
Seagrass restoration
Check wave energy and seabed stress before you plant, to find where seagrass and other submerged plants will hold.
Living shorelines and oyster reefs
Compare candidate sites, and test a sill, breakwater or seawall with before-and-after maps.
Agencies and permitting
Consistent, documented exposure classes across a whole estuary, with a PDF report for the file.
Aquaculture
Compare lease and gear sites by the waves and seabed forces each will see.
Research and teaching
A tested fetch-based model with nothing to install, from a handful of sites to 50,000 in one run.
No data to prepare
NOAA Coastal Relief Model depths on the US coasts, GEBCO 2026 elsewhere, hourly wind back to 1940 and nearby buoys come built in. Or upload your own survey and wind.
Checked against SWAN and wave buoys
The model's assumptions and limits are set out in How it works.
Built on NOAA's published Wave Exposure Model
The Wave Exposure Model was formulated at NOAA's National Centers for Coastal Ocean Science by Amit Malhotra and Mark Fonseca and published in 2007 as NOAA Technical Memorandum NOS NCCOS 65. It has been used to site seagrass restoration, design living shorelines and assess shoreline erosion. This web app is built by Geo Horizons, founded by Amit Malhotra. It keeps the original formulation as a setting and adds the shallow-water physics a spectral wave model would include. More about the model.
An independent product of Geo Horizons, not affiliated with or endorsed by NOAA.
Free while WEMo is in early access
Every account gets the full model. No card, no trial period.
- Model runs of up to 50,000 sites, one run at a time
- Up to 5 saved projects
- GEBCO bathymetry and up to 30 years of hourly wind
- Wind roses, result maps, PDF reports and GIS downloads (CSV, GeoJSON, GeoTIFF)
- API access for your own scripts (Python, R, curl)
Questions
What is a wave exposure model?
A wave exposure model estimates how much wave energy reaches a place from the waves the wind raises on the water around it. WEMo measures the fetch (how far the wind can blow over water toward a site) in every direction, grows waves along it over the real depths, and weights each direction by how often and how hard the wind blows from it.
Where does WEMo work best?
In sheltered water: bays, estuaries, sounds, lagoons, rivers and lakes, where most waves are made by the local wind. On open coasts and near bay mouths ocean swell matters too; WEMo can add it to a run and reports it separately.
How accurate is WEMo?
Across 939 lower Chesapeake Bay sites, 98% of WEMo's wave heights were within 20% of the SWAN spectral wave model at a 10 m/s wind, and WEMo has been compared hour by hour with 31 wave buoys over 2022–2024 in four basins. It is a tool for screening and planning: for engineering design, use a detailed model and a coastal engineer.
How is WEMo different from SWAN?
SWAN is a spectral wave model that solves the wave energy balance on a computational grid, which takes setting up and computing time. WEMo is fetch-based: there is no grid or boundary condition to set up, it runs from a web browser, and its shallow-water physics (depth-limited growth, bottom friction and breaking) was tuned against SWAN.
Do I need my own depth or wind data?
No. WEMo brings NOAA Coastal Relief Model depths on the US coasts and GEBCO 2026 depths elsewhere, hourly wind back to 1940, and the measured wind of nearby buoys and weather stations. You can upload your own bathymetry survey (GeoTIFF) or wind record (CSV) instead.
Is this NOAA's WEMo?
It is built on the Wave Exposure Model that NOAA published in 2007 (Malhotra & Fonseca, NOAA Technical Memorandum NOS NCCOS 65), by Geo Horizons, founded by the model's co-developer Amit Malhotra. Its "Original 2007 model" setting reproduces NOAA's implementation exactly. This web app is an independent product of Geo Horizons, not affiliated with or endorsed by NOAA.
Can I run WEMo from my own scripts?
Yes. Make a personal API key on your projects page and run WEMo from Python, R, curl or your own software: send your sites, and get wave height, RWE, orbital velocity and bed shear stress back as JSON, CSV, GeoJSON or GeoTIFF. It uses the same model, data and limits as the web app. See the WEMo API guide.
What does WEMo cost?
WEMo is free during early access: every account gets model runs of up to 50,000 sites and up to 5 saved projects. For a demo, training or a custom study, email [email protected].
Looking for other ways to model wave exposure? See how WEMo compares with NOAA's WEMo, other fetch models and SWAN, and our guide to wave exposure tools, models and data.